Logs
Logs are a very useful aspect of web server administration and web development. They provide useful debugging information and let you analyze traffic and errors on your website.
The easiest way to view your logs is directly in the Templ Panel using the Logs tab. You can also access the raw log files on the server over SSH, SFTP or the file manager.
View logs in the Templ Panel
To view your logs in the Templ Panel:
- Navigate to Websites.
- Click on the website you want to view logs for.
- Open the Logs tab.
Under Log, choose which log to view:
- Traffic log - a list of all requests that visitors and bots have made to your website, including how long the server took to generate each request.
- Error log - any errors or warnings that have occurred on your site or server, useful for debugging.
Under Lines, choose how many of the latest entries to fetch (the latest 50, 100 or 500 lines), then click Fetch logs.
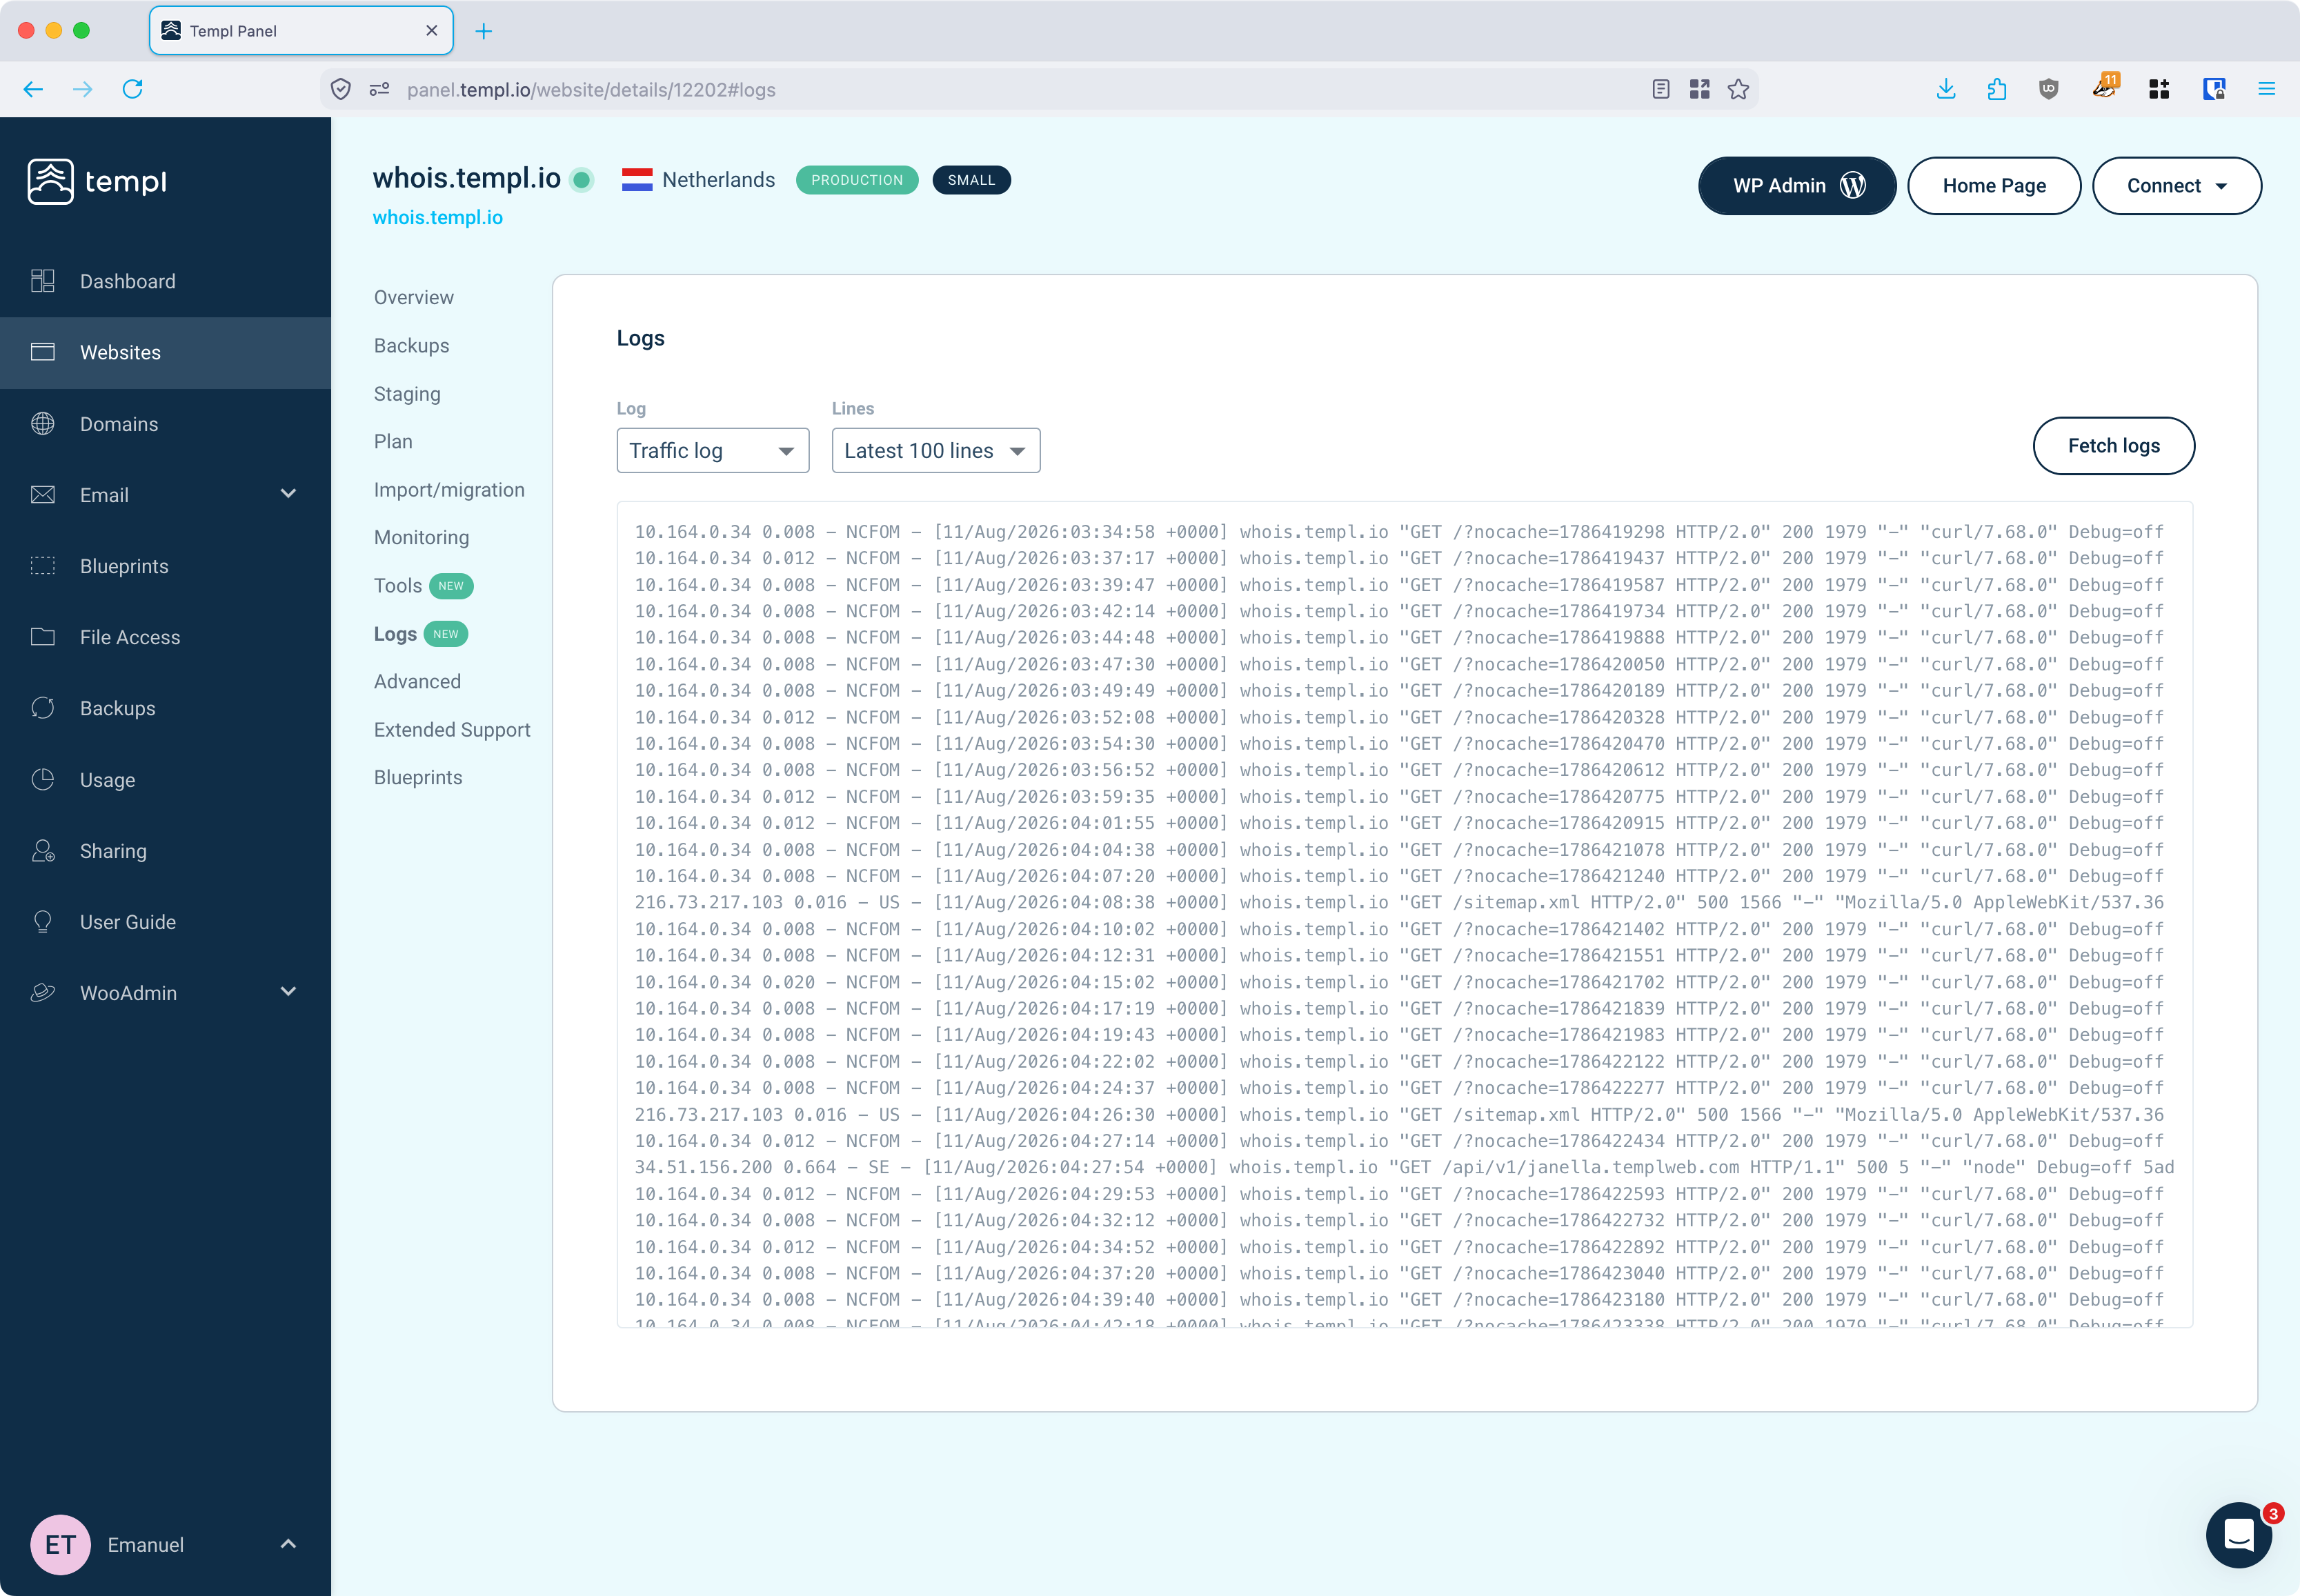
Understanding the traffic log
All requests to your site are written to a single access log, regardless of which PHP pool served them - one of the columns below records the pool for each request. Requests for static files (such as images, CSS, JavaScript, PDFs, text files and videos) are not logged and do not appear in the access log.
Each line in the traffic log represents a single request to your website. A typical row looks like this:
203.0.113.7 0.052 - MISS [11/Aug/2026:06:46:14 +0000] www.example.com "GET / HTTP/2.0" 200 69208 "-" "Mozilla/5.0 (Windows NT 10.0; Win64; x64)" Debug=off 6296593c5f6919b843927f7f142eb985 203.0.113.7 app
The columns, in order, are:
| Column | Example | Description |
|---|---|---|
| IP address | 203.0.113.7 | The IP the request arrived from (may be an internal Templ proxy address) |
| Response time | 0.052 | Time in seconds the server took to process the request |
| Internal | - | Internal Templ field |
| Cache status | MISS | Templ Cache result: HIT, MISS, BYPASS, or - when not applicable |
| Timestamp | [11/Aug/2026:06:46:14 +0000] | Date and time of the request (UTC) |
| Domain | www.example.com | The domain name that was requested |
| Request | "GET / HTTP/2.0" | HTTP method, path and protocol |
| Status code | 200 | HTTP response status (e.g. 200, 404, 500) |
| Response size | 69208 | Number of bytes sent to the client |
| Referrer | "-" | The referring page, "-" if none |
| User agent | "Mozilla/5.0 ..." | The visitor's browser or bot identifier |
| Debug | Debug=off | Whether debug mode was enabled for the request |
| Request ID | 6296593c... | Unique ID for the request |
| Client IP | 203.0.113.7 | The visitor's originating IP address |
| PHP pool | app | Which PHP pool served the request: app, or low for the throttled low-priority pool |
The Request ID is useful when contacting our support about a specific request, as it lets us find the exact entry across our systems.
The error log follows the standard nginx and PHP error log format, with a timestamp and severity level for each entry, and contains the errors and warnings generated by your site or server.
Accessing the raw log files
For most debugging, the Logs tab in the Templ Panel is the fastest option - use the raw files for entries older than today, additional domain names, or downloads.
You can access them using any of the following:
- SSH - connect to your server and view or follow the files from the command line.
- SFTP - open the files directly in your SFTP client, or download them and open them in a text editor.
- Templ file manager - browse to the files in the panel's file manager.
Web server logs
The web server logs are located in /var/log/nginx/.
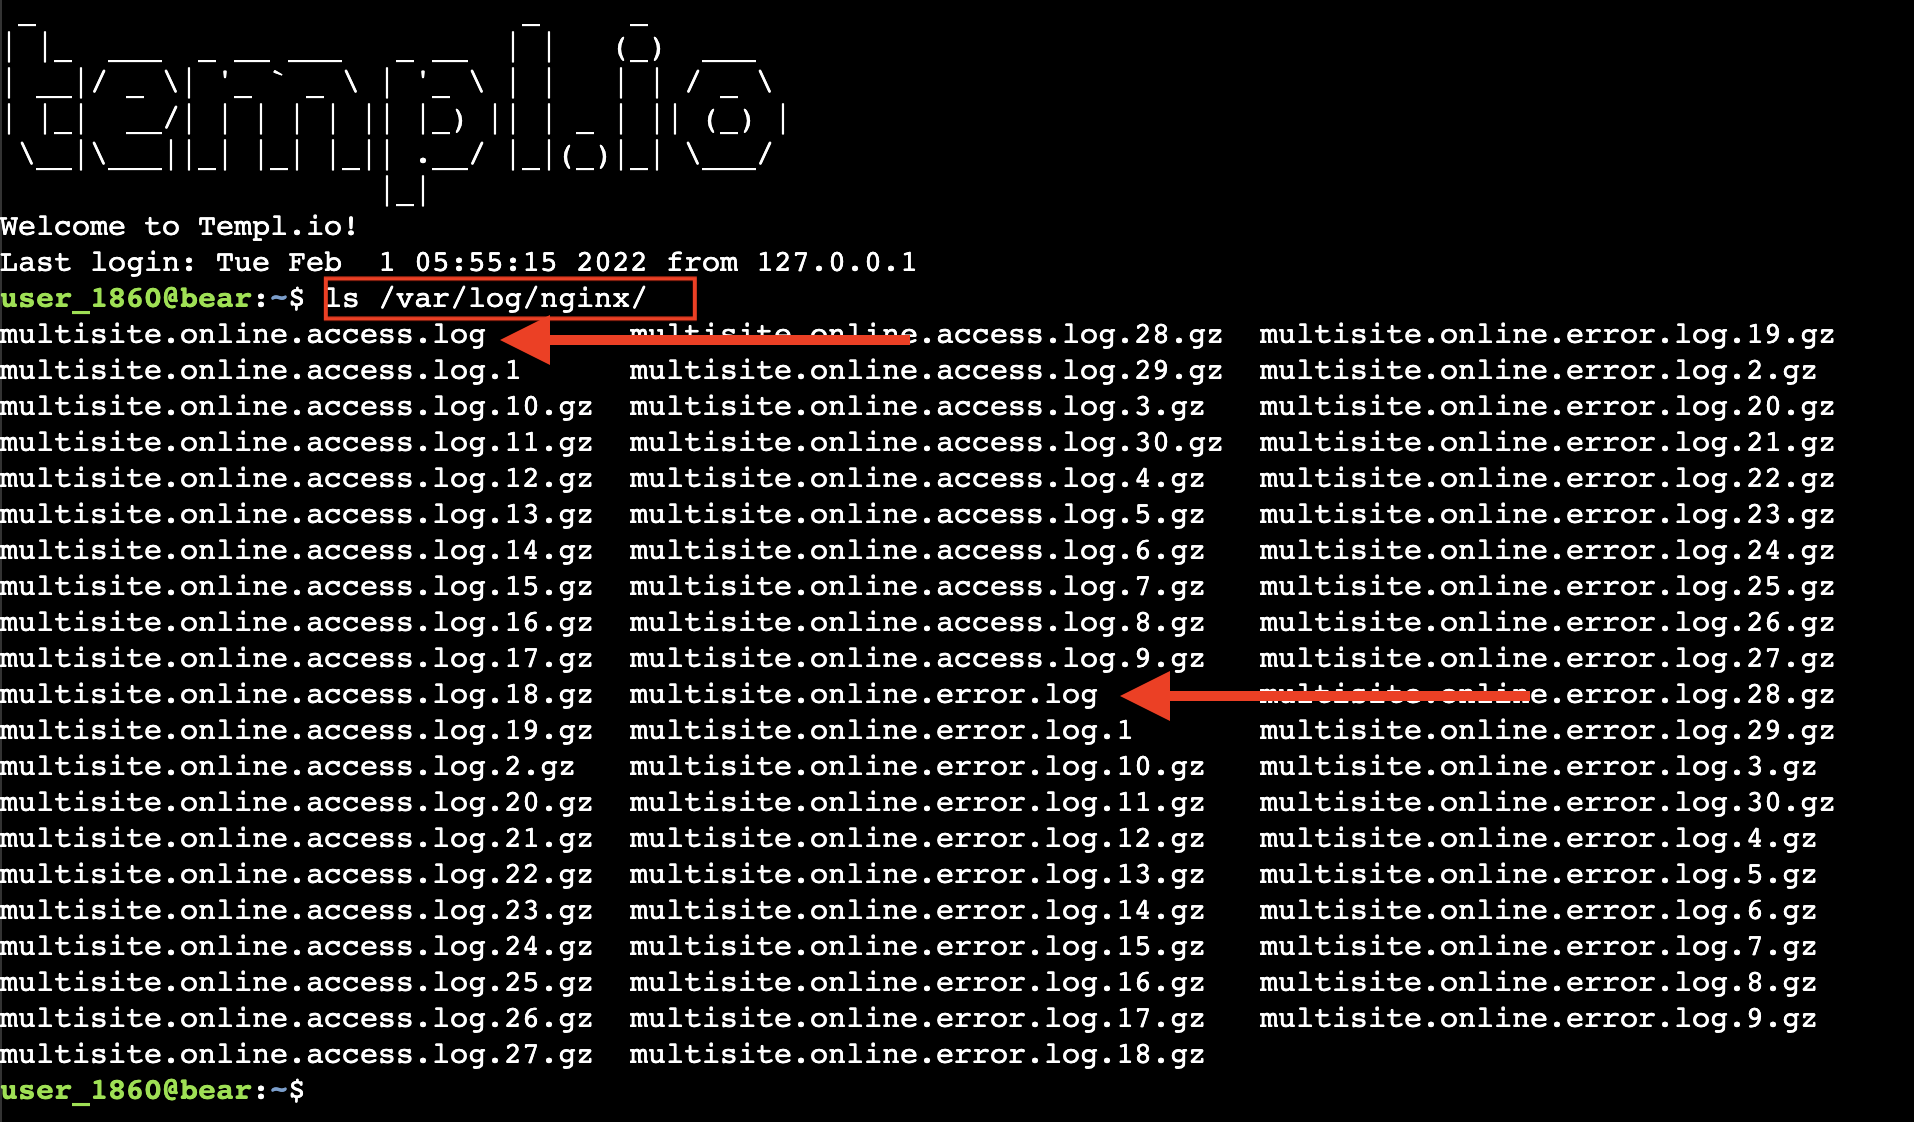
There are two main logs:
<domain>.access.log- the traffic log described above.<domain>.error.log- the error log described above.
PHP logs
Templ does not create separate per-pool PHP-FPM log files (such as a php-fpm-slow.log). PHP errors and warnings appear in the site's <domain>.error.log. On a WordPress site, if you enable WP_DEBUG and WP_DEBUG_LOG, WordPress additionally captures most PHP notices, warnings and errors to wp-content/debug.log.
Email log
If your website sends email through Templ's SMTP service, the sending is logged in:
/var/log/msmtp/mail.log
Cron and timer logs
/var/log/timers/cron.log- logs each run of your website's server cron, if server cron is enabled./var/log/timers/*.log- any additional custom cron jobs configured for your website are logged in their own file here.
Following logs in real time
An effective way to view the log files is to connect to your server with SSH, then use the command:
tail -f /var/log/nginx/<domain>.access.log
This command will show you the log entries in real time.
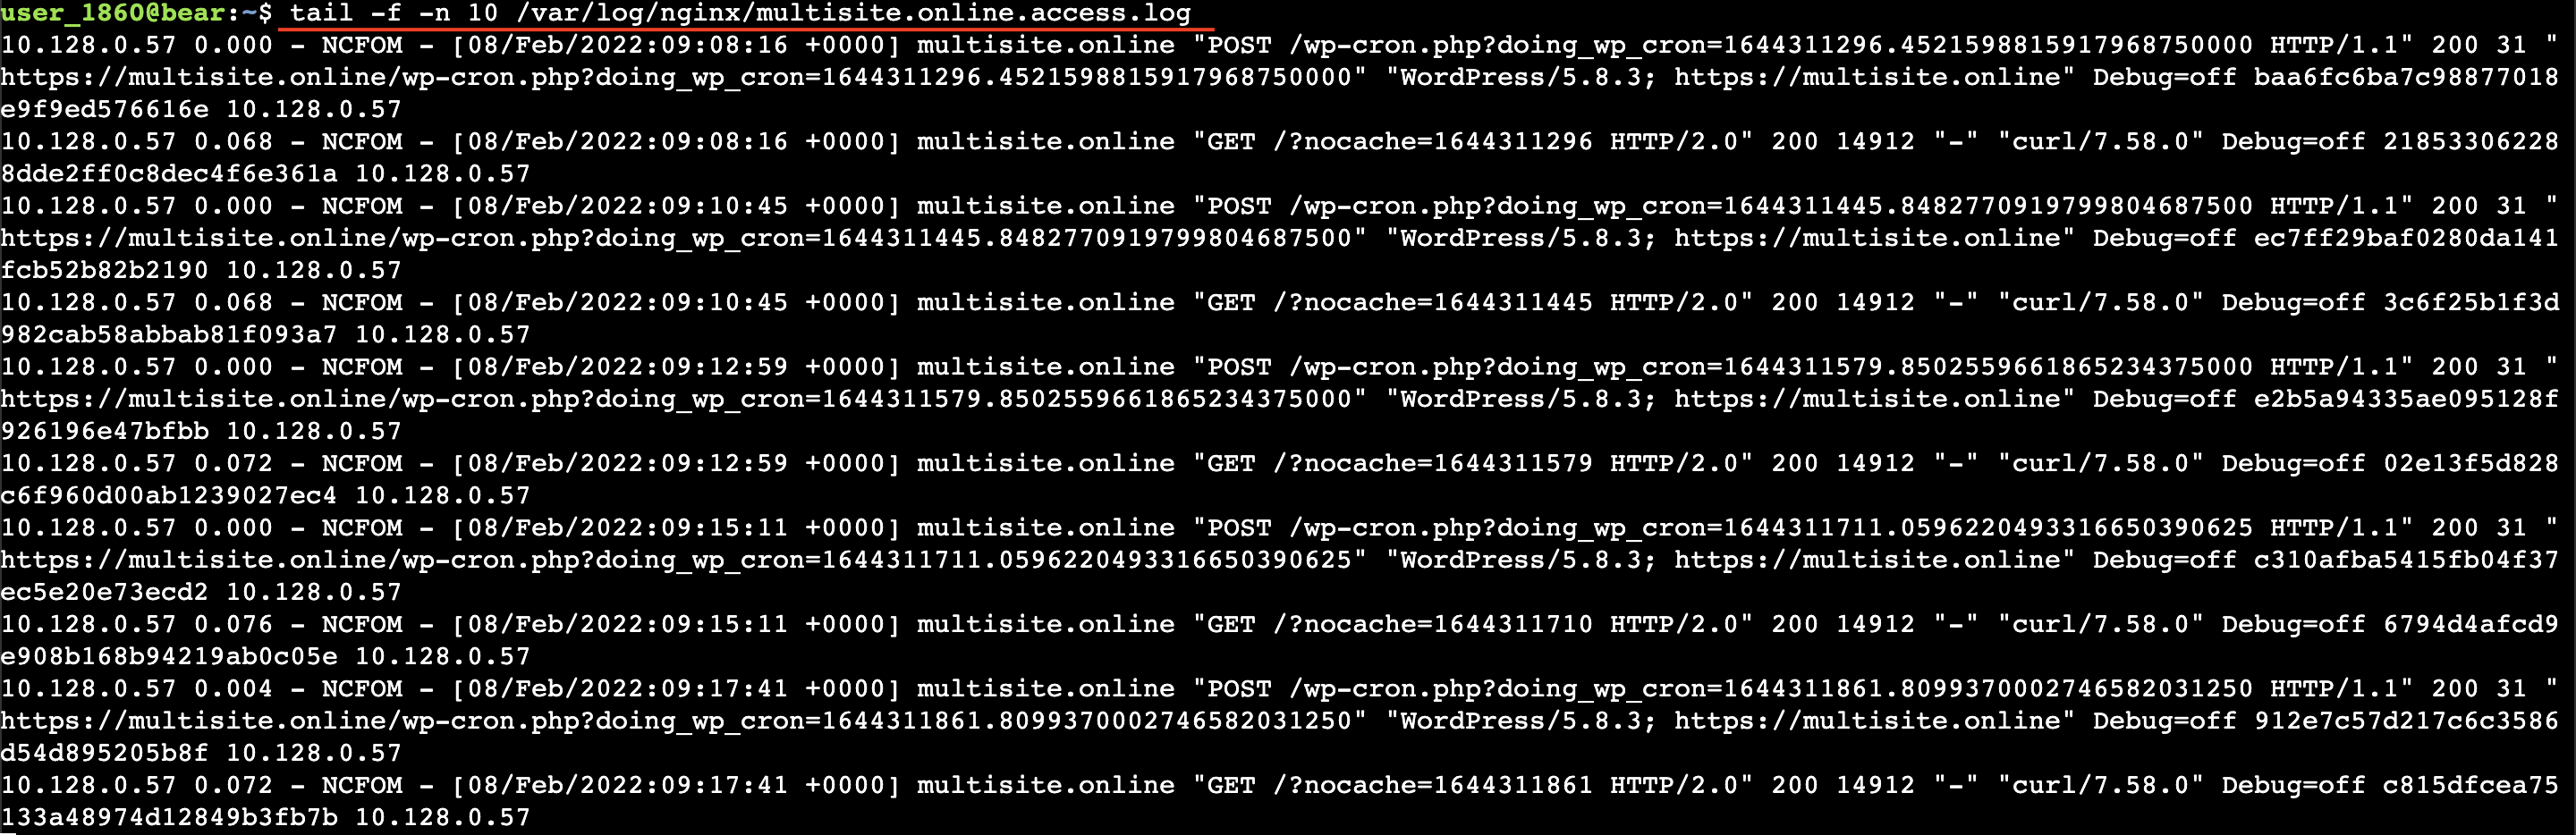
tail -f -n 10 /var/log/nginx/<domain>.access.log
This will show the last 10 entries of your access log in real time.
Remember to change <domain> to your actual domain.